The hardest game: predicting a recession
Macro, finance and crypto charts of the week for 11/24/22. This week we predict the next recession.
Dear frontrunners,
Happy Thanksgiving to all of frontrun’s US readers. I am grateful for the 135 new subscribers who have joined the frontrun community over the past 14 days. A pleasant surprise given the abundance of high-quality independent journalism that permeates across platforms like substack and medium.
The intersection of research across the crypto, macro, and financial markets is an in-demand and emerging space that we will continue to explore together as we front-run the next generation of wealth creation.
The first principle of frontrun is the realization that the information you need to win is already available. Unfortunately, most people ignore it because it sounds too complicated, even though it is not.
This is why every week (starting now), we’ll share a weekly review of crypto, macro, and finance charts and attempt to assess their relevance in the broader market.
Our theme for this week is “The hardest game: predicting recessions”
Recession indicators and labor force participation
Are we in a recession? Answering this question reminds me of a childhood game Whac-a-mole. It’s an arcade game where players use a mallet to hit toy moles, which appear randomly, before returning back into their hole. Watching investment banks and government regulators create complex charts and research papers in an attempt to answer the question “are we in a recession?” is a disjointed, inconsistent, and perhaps intentional attempt to keep the masses confused and disinterested. For example:
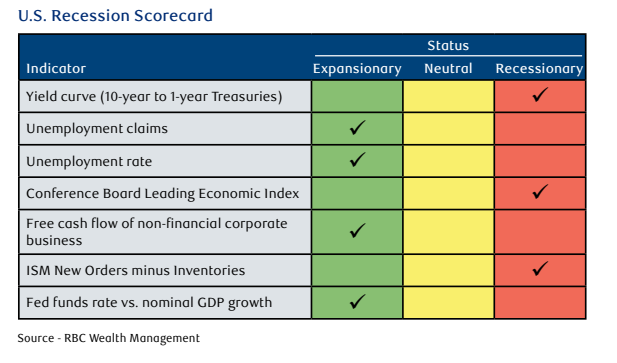
RBC Wealth Management publishes a quarterly “US Recession Scorecard” which is a composition of 7 indicators, including one indicator which is really a composite of 10 other indicators. If you need a refresher on how these KPIs are defined, you can review an assessment we published in August 2022.

Their position?
The indicators that have flipped to recessionary status so far, together with the most recent low in unemployment claims (March 2022), point toward a recession getting underway by Q2 2023, in our view. - RBC Wealth Management November 2022
RBC’s prediction of “a recession getting underway by Q22023” is predicated on a 100 basis point uptick in the “unemployment rate” from 3.5% to > 4.5%. What I’ve always found questionable is how economists calculate “unemployment”.
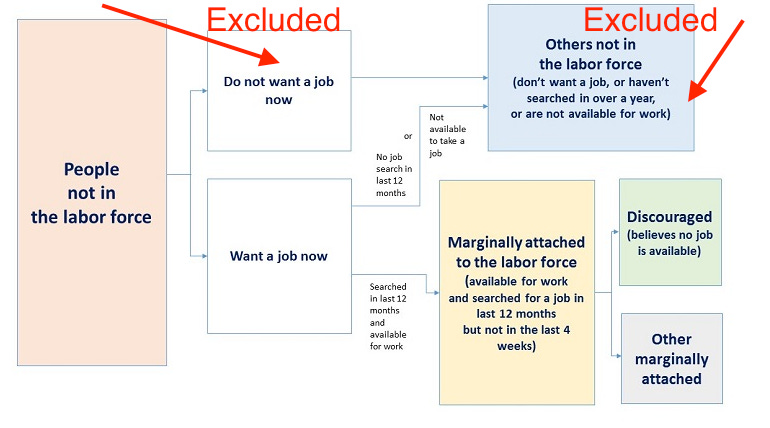
The unemployment rate is calculated as the number of unemployed people as a percentage of the labor force. “Labor force” is measured by US economists such that it excludes individuals who have not been “actively looking for work in the past 4 weeks”. What? Here is the chart from the BLS outlining what segment of the “unemployed” population is included in the “unemployment rate”

Why are economists and bankers excluding individuals who are not looking for jobs from the “unemployment rate” calculation? They are by definition, unemployed. We include this segment of the population in GDP growth and consumption, so why not include them in unemployment? I’m happy to make the case for excluding retirees from the labor force, but for the sake of completeness, all able-bodied working adults should be included in the labor force.
Setting “labor force participation” aside, our friends at Goldman Sachs are taking a similar point of view that a US recession is unlikely in 2023, assigning a probability of 35%
Their assessment is that core inflation as measured by the “Personal Consumption Expenditures Index (an aggregate measure of prices people pay for goods & services) will revert to its mean by 2024 while unemployment will only marginally increase by approximately 50 basis points as a result of unprecedented job openings:

How is it possible that the federal reserve can bring down inflation to ~3% without causing widespread unemployment? Maybe this time it’s different?
GS thinks “The persistent state of low unemployment is not a byproduct of excessive employment but rather unprecedented job openings”. This means that low unemployment is not a result of individuals working multiple jobs; it is a result of employers having multiple job openings…
…and “The deleveraging of housing markets and the disinflationary impact of the supply chain normalization is just getting started” is just a fancy way of saying the cost of stuff we buy will go down…
…and their quants have concluded, “Long-term inflation projections remain anchored relative to the 1970s”. So a bunch of economists performed some surveys, create research papers, and decided that inflation will run 3% y/o/y normalized.
…but what about the yield curve? The shape of the U.S. Treasury yield curve is often looked at as a barometer for U.S. economic growth. It reflects how the Federal Reserve intends to stimulate or slow economic growth by cutting or raising its policy rate. In a risk on low-interest-rate environment:
Short-term bonds (like US treasury bills) have lower yields to reflect the fact that an investor’s money is at less risk
The rationale behind this is that the longer you commit your capital, the more you should be rewarded for that commitment. This is reflected in what’s called a “normal yield curve”, where the curve slopes up and to the right as the bond’s maturity date increases further into the future, depicted below.

During periods of economic slowdown, yield curves “invert” as investors "flee to safety” by purchasing short-dated government bills and notes. This is reflected in what’s called an “inverted yield curve”, where the curve slopes down and to the right as the bond maturity date increases further into the future, depicted below.

We know from historical data that short-term yields rise in parallel with inflation:

It seems counter-intuitive; why would long-term investors settle for lower rewards than short-term investors, who are assuming less risk? When long-term investors believe this is their last chance to lock in current rates on long-dated treasuries, they become less demanding of lenders.
Consider from 2020 through 2021 we had a government-induced shutdown of the global economy and a US central bank that printed $5 trillion dollars of new money. The result?
An increase in consumer savings which led to…
… pent-up demand for goods and services..
..with corporations unwilling or unable to keep pace with consumer demand..
…the price of all goods and services goes up…
This is inflation. The amount of stuff you can buy for a dollar goes down. This leads central banks to:
…reduce the total number of dollars in circulation (quantitative tightening)…
… and increase the cost of borrowing (the federal funds rate)…
..which further decreased the consumer’s spending power…
Why would the central bank do this? To force consumers into spending less. When there is a decrease in consumer spending coupled with an increase in the cost of borrowing…
….corporations make less money, which forces firms to lower their capital spending, hiring, and investing.
We see this happening in realtime: across the S&P 500, 2022 GAAP earnings growth has decreased 10% y/o/y:

The basket of companies in the S&P500 is telling investors to “manage their expectations” with respect to earnings in the calendar year 2023. A decrease in earnings makes the E in P/E ratio smaller, which increases the price an investor pays for each dollar of profit. Investors hate this. If E in the P/E ratio won’t go up, then the P (share price) must go down. When the share price goes down, the aggregate market cap of the firm decreases.
But when this happens to all companies, it signals to the broader market that a slowdown in growth (earnings, hiring, investing) is in progress. This causes long-term investors to temporarily, “flee to safety” by purchasing government-backed treasury notes.
Why would an investor commit capital to a risk-on asset underperforming US-backed government notes paying north of 4%? They wouldn’t. Consider the broader US residential real estate market now has an average cap rate (net income produced by the property divided by its market value) lower than the annual yield on a 6-month t bill.


Note there is a second-order implication with increased borrowing costs in that it increases a company’s debt service coverage ratio. US corporations have a record amount of debt, and unless it’s securitized with long-duration bonds, it will be refinanced but now at a higher interest rate. Ouch.

Putting it all together we can extrapolate the following:
…ongoing inflationary pressures, pent-up consumer demand, and a persistent state of over-employment combined with…
…investor concerns related to liquidity risk and financial markets…
…are causing a “flight to safety” whereby risk-on assets are being liquidated in exchange for short-term government bills.
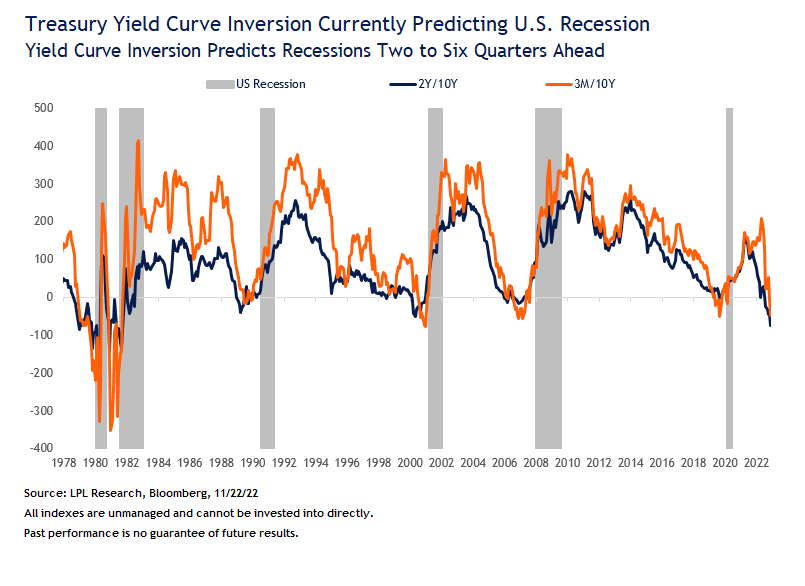
When we take the difference between a short-dated treasury bill and a long-dated treasury note, the “spread” between the bill and the note is used to calculate a potential “yield curve inversion”, where the yield on a short-term t-bill is > the yield on a long-term government note. The chart below depicts the difference between a 2Y/10Y and 3M/10Y pair.
The past six times the 2Y/10Y part of the yield curve inverted, a recession followed, on average, 18 months later.
The 3M/10Y signal has predicted every U.S. recession since 1950.

…so are we in a recession? The answer is somewhere between yes, no, and maybe:
RBC Wealth Management = 42% probability of a recession
Goldman Sachs = 35% probability of a recession
3Y/10Y yield curve inversion = 100% probability of a recession
and for bonus points: “The Conference Board Leading Index Indicator” (which is also one of RBC’s metrics in its US Recession Scorecard) is predicting a recession in March 2023.

What this means for you
Esoteric assessments of the broader global economy using a composition of indicators from government analysts and investment bankers probably has zero impact on your day-to-day life. When I spend time with friends and family who don’t follow the markets, they truly could care less about the 3M/10Y yield curve inversion. Recessions are a first-world problem reserved for the one percent with significant exposure to the capital markets.
Are we in a recession? Unfortunately, it depends. I live in San Francisco, and Porsche just announced the opening of a new dealership in March 2023 - the predicted start of the recession! Are we in a recession? Not according to Porsche.
Moreover, I recently went on a family vacation to Universal Studios in Orlando, Florida USA, and managed to snag a picture of the attendance at “Wizarding World of Harry Potter”..this was on a Tuesday. It was PACKED. Are we in a recession? It doesn’t look like it from this picture.
The hardest game? For economists to aspiring investors, it might be predicting a recession, but don’t fret. At least you weren’t one of those suckers who bought bitcoin at its all-time high because it’s now the worst-performing asset class of 2022….oh wait 🤣

To knowledge and wisdom,
John Cook
San Francisco, CA
November 25th, 2022
www.frontruncrypto.com
Article cover generated by DALL-E: “An expressive oil painting of economists huddled around a chalkboard predicting the next recession”
Prediction of the week - ARK’s Cathie Woods on bitcoin to $1 million USD by 2030


