A message to the poors: eat cereal for dinner
The economic class divide and what it means for crypto
Dear frontrunners,
In an interview that approaches SNL level of comedy, Steve Cahillane, the CEO of the Kellogg’s Company, recently appeared on CNBC saying poor people should eat cereal for dinner to save money. Truly amazing stuff. The folks from Breaking Points published a clip below, everyone should watch the clip up to minute 1:56.
Look at the palatial estate Steve is taking the interview from. Do you think his kids eat cereal for dinner? Do you think he even eats cereal? Not a chance.
I’ve tried to wrap my head around the broader equities rally we’ve experienced over the past 12 months despite the weakness in US consumer performance. No doubt folks like Steve are direct beneficiaries.
In prior posts, I’ve outlined why the US investor is staring down the barrel of a recession as a result of increased material costs, growing consumer debt, and lower-than-expected corporate earnings.
I even opined why Wall Street analysts are generally full of sh*t, can't tell heads from tails with respect to market movements, and are oblivious to the imminent destruction of wealth their wealth management counterparts are about to experience.
Yet here I am, 12 months later, writing on how the S&P 500 just reached all-time highs…
…moreover, bitcoin is on an absolute rip, and the economic recession, as well as the debasement of the US dollar, never happened (yet?).
When I think of all of the popular talking points that lead to an economic collapse and sustained period of wealth destruction, in no particular order the most common points I hear are:
High-interest rates
Prolonged periods of government overspending
Destruction of consumer savings
Increase in consumer debt
Lower-than-expected corporate earnings
A global war against terror (or fight for the ‘soul of democracy’?)
Declining American patriotism and shared system of beliefs or values
An incompetent government
I could go on and on, I’m sure you have other points I’ve missed, but you get the idea.
More spending + less savings + more debt + low societal cohesion = less $$$ for everyone.
I do believe this is still true, but only for the 99%. But the 99% don’t control US equities, set direction for domestic and global monetary policy, or even have a seat at the table.
People like Steve Cahillane set the tone and direction, it’s the one percenters. It’s always the one percenters. This isn’t a rip against them, it's an observation on how they…specifically American investors… act as the invisible hand of the global economy.
Here is the data:
US personal saving rate: 3.7% vs a historical average of ~8%.
This means the average American is only able to save ~$3 for every $100 earned.
US consumer credit card debt has increased by 15% y/o/y:
The average outstanding balance is ~ $6,800 and is higher in states like NJ, CA, NY, CT, or anywhere with an HCOL. This doesn’t include other revolving debt like HELOCs, student loans, auto loans, car leases, payday loans, etc.
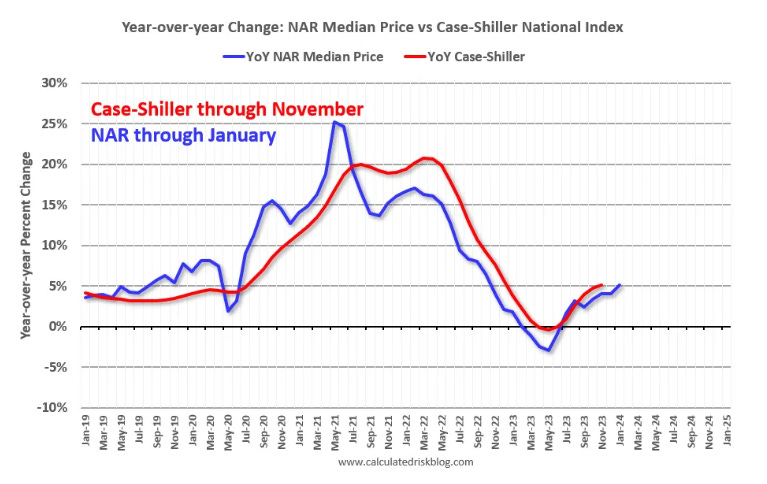
US median home prices have increased 5.1% y/o/y to ~$379,100.
31% of all households now spend > 30% of their income on housing costs, 50% of renters spend > 30% of their income on housing, and 30-year fixed rate mortgages still hover at ~7.00% before points and pre-payment.
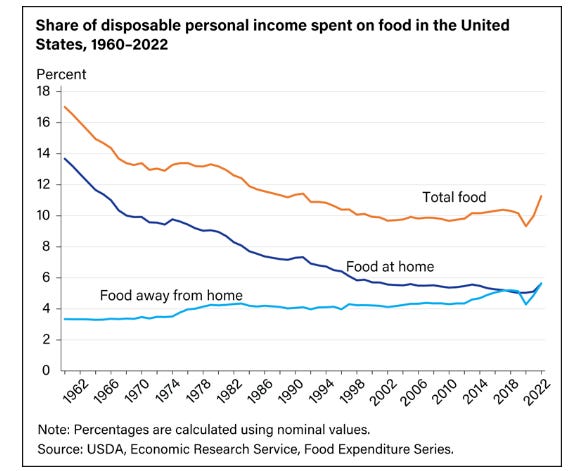
Consumer spending on food is at a 30-year high at 11.3% of personal income
This means 11% of every post-tax dollar earned is spent on food. This is a 13% increase from 2022 off the back of a 25% increase in food prices from 2019. In fact, the lowest quartile of households spent ~31% of their personal income on food in 2022.
…and of course the fed funds rate (blue line, rate at which big banks charge each other to lend extra $$$)
…. is up and to the right. Who does this impact? First-time homeowners, the working poor, small businesses, w2 earners, the 99 percent. Jerome Powell isn’t done yet, on a mandate to get inflation down to 2% his motto is clear: “higher for longer fam”. The plebs have yet to feel max pain.
I won’t even touch on CPI data with respect to services, energy, etc, but it is undeniable everything is more expensive and wages are not growing at a pace to match the associated cost of living increases.
So how do equities (orange line, above) keep going up despite the increase in interest rates (blue line, above) & decrease in savings? I’ll take it a step further….there seems to be an inverse relationship across the market w.r.t to equities & interest rates. As interest rates go up (measured via 10-year treasury yields), equities go up.
To quote our friends at BlackRock:
…history suggests that higher interest rates can help, not hinder, stocks.
This is initially difficult to understand because higher rates = higher borrowing costs = higher discounted cash flow = lower present value for those in DCF land.
But BlackRock rationalizes this by comparing 10-year yields against real interest rates. This is the nominal interest rate - inflation. e.g. if 10 year treasury bills yield 10%, and inflation is 7%, then real interest rates are 10% - 7% = 3%. A visualization of the relationship is below:
As real rates increase, the S&P 500 P/E increases. This is a benefit for the rich and a problem for the poor. The one percenters are all hedged against the US dollar (the loser of the real-interest rate paradigm) in assets like real estate, crypto, gold, equities, etc. These assets all appreciate in value as ‘real rates’ increase.
But how many of your normie friends care about real vs nominal interest rates on 10-year treasury bills? How often did that topic come up during the Super Bowl? Probably less than the number of times Taylor Swift appeared on TV.
Regular people care about:
Utilities (lights, electricity, stuff people can’t live without) which is more expensive today than yesterday
Consumer staples (cereal, the basic necessities of life) which is more expensive today than yesterday
Housing (people need a place to live) which is more expensive today than yesterday
People care about the costs of food, water, shelter, and electricity. Yet the US government continues to spend into oblivion to fight wars in faraway lands. American taxpayers ultimately pay this price, with US debt service approaching ~$1 trillion per year, and in the aggregate, the US taxpayer is on the hook for ~$37 trillion (that is 37 with 12 zeros) of debt excluding interest. Good luck to our grandkids. Investors see this and are fleeing to international markets (e.g., MSCI ACWI xUSA).
The S&P 500 outperformance over the past 12 months is a function of the large-cap growth stocks, which have an outsized impact on the index performance. This is the magnificent seven: Microsoft, Apple, Nvidia, Google, Amazon, Meta, and Tesla.
These seven companies are responsible for ~76% of the S&P 500 2023 performance and have served as the rocketship of outperformance vs their small-cap (Russell 2000) counterparts.
Large-cap companies (magnificent 7, etc) have:
A higher cash reserve
Are less sensitive to changes in interest rates
Are able to more effectively service their debt
Have a team of expensive attorneys and lobbyists advocating “for their interests”
…smaller companies are more dependent on debt issuance than many of the large, profitable growth companies that suffered setbacks when rates initially shifted higher. “For many smaller companies, the cost of funding at higher interest rates will become a challenge more quickly than is the case for many larger companies, which often issue longer-term debt,” says Haworth. “Higher borrowing costs can cut into a company’s earnings.” Markets appeared to recognize this fact. As a result, after underperforming small-cap stocks in 2022, large-cap growth stocks far outpaced small stocks in 2023 and have started 2024 in the same, advantageous position.
When you couple these aforementioned points with prolonged consumer spending, an increase in consumer debt, the inability to avoid incremental costs associated with housing, food and utilities, the net result is an environment where large-cap equities and companies that sell consumer packaged goods crush it, despite the intuitive feeling that we all have which tells us “something isn’t right”.
It’s not just the consumer, a broad basket of “economic indicators” all point down and to the left for non-financial firms (e.g. companies that build stuff):
Manufacturing hours → down
Building permits issued → flat
Business conditions → down
Manufacturing orders → down
It’s almost as if there is a segment of the population that is completely detached from reality. It’s because they are. This is true for large-cap publicly traded firms, as well as privately held VC-backed start-ups and M&A acquisitions.
What does this have to do with crypto?
In a nutshell, everything. With the announcement of the bitcoin etf, upcoming eth etf (5/30/24 fingers crossed) and tradfi wealth advisors like Fidelity adding bitcoin as an asset to their 60/40 fund….
….we should take a moment and say the quiet part out loud. Crypto, the asset class, is being financialized by the tradfi market. Bitcoin, eth, sol, etc are all extensions of the S&P 500 and Nasdaq 100.
Bitcoin is highly correlated to the S&P 500.
Ethereum is highly correlated to Bitcoin.
Altcoins are highly correlated to Ethereum.
In a 2023 study by the CFA Institute, it was determined that:
….From 2019 to 2022, however, the S&P Cryptocurrency Broad Digital Market Index (SPCBDM)’s correlation to the S&P 500 rose from 0.54 to 0.801, indicating that cryptocurrencies have moved increasingly in tandem with equities.
You can see real-time correlation data here.
Moreover, Pantera Capital just published their quarterly newsletter exploring the relationship between bitcoin and the halving rallies, depicted below….
…and this stuff just makes me roll my eyes. The halvings all occurred during US election cycles.
The average return of the S&P 500 during an election year is 11.28% There have been 23 elections since the inception of the S&P 500. 19 have provided positive returns. There have been 4 US elections since the inception of bitcoin (2012, 2016, 2020, and 2024 TBD).
Returns as follows: 2012 = 16%, 2016 = 12%, 2020 = 18.37%, 2024 = TBD. Consider this, though, prediction markets like polymarket assign a 55% win probability to Trump, and over the past 23 election cycles, when a Democrat was in office and replaced by a Republican, the total return for that year averaged 12.9%.
So if:
Bitcoin is strongly correlated to the Nasdaq 100 and S&P 500…
…and Ethereum is strongly correlated to Bitcoin…
…and altcoins are strongly correlated to Ethereum…
…what direction will crypto prices go? It depends, on tradfi markets. And since tradfi markets are completely detached from reality, crypto assets may rise despite the continued erosion of the middle class. With that said, I do believe an inflection point is upon us, if corporate earnings from tech companies can’t keep pace with investor expectations, we will all feel max pain, then maybe folks like Steve Cahillane will finally have a taste of their own medicine: cereal for dinner.
To knowledge and wisdom,
John Cook
February 22nd, 2024
San Francisco, CA
www.frontruncrypto.com
Article cover generated by DALL-E: “A Van Gogh style painting of plebians eating cereal for dinner.”


